Recommended AI Tools
5We've analyzed the market. These tools offer specific features for create interactive charts.
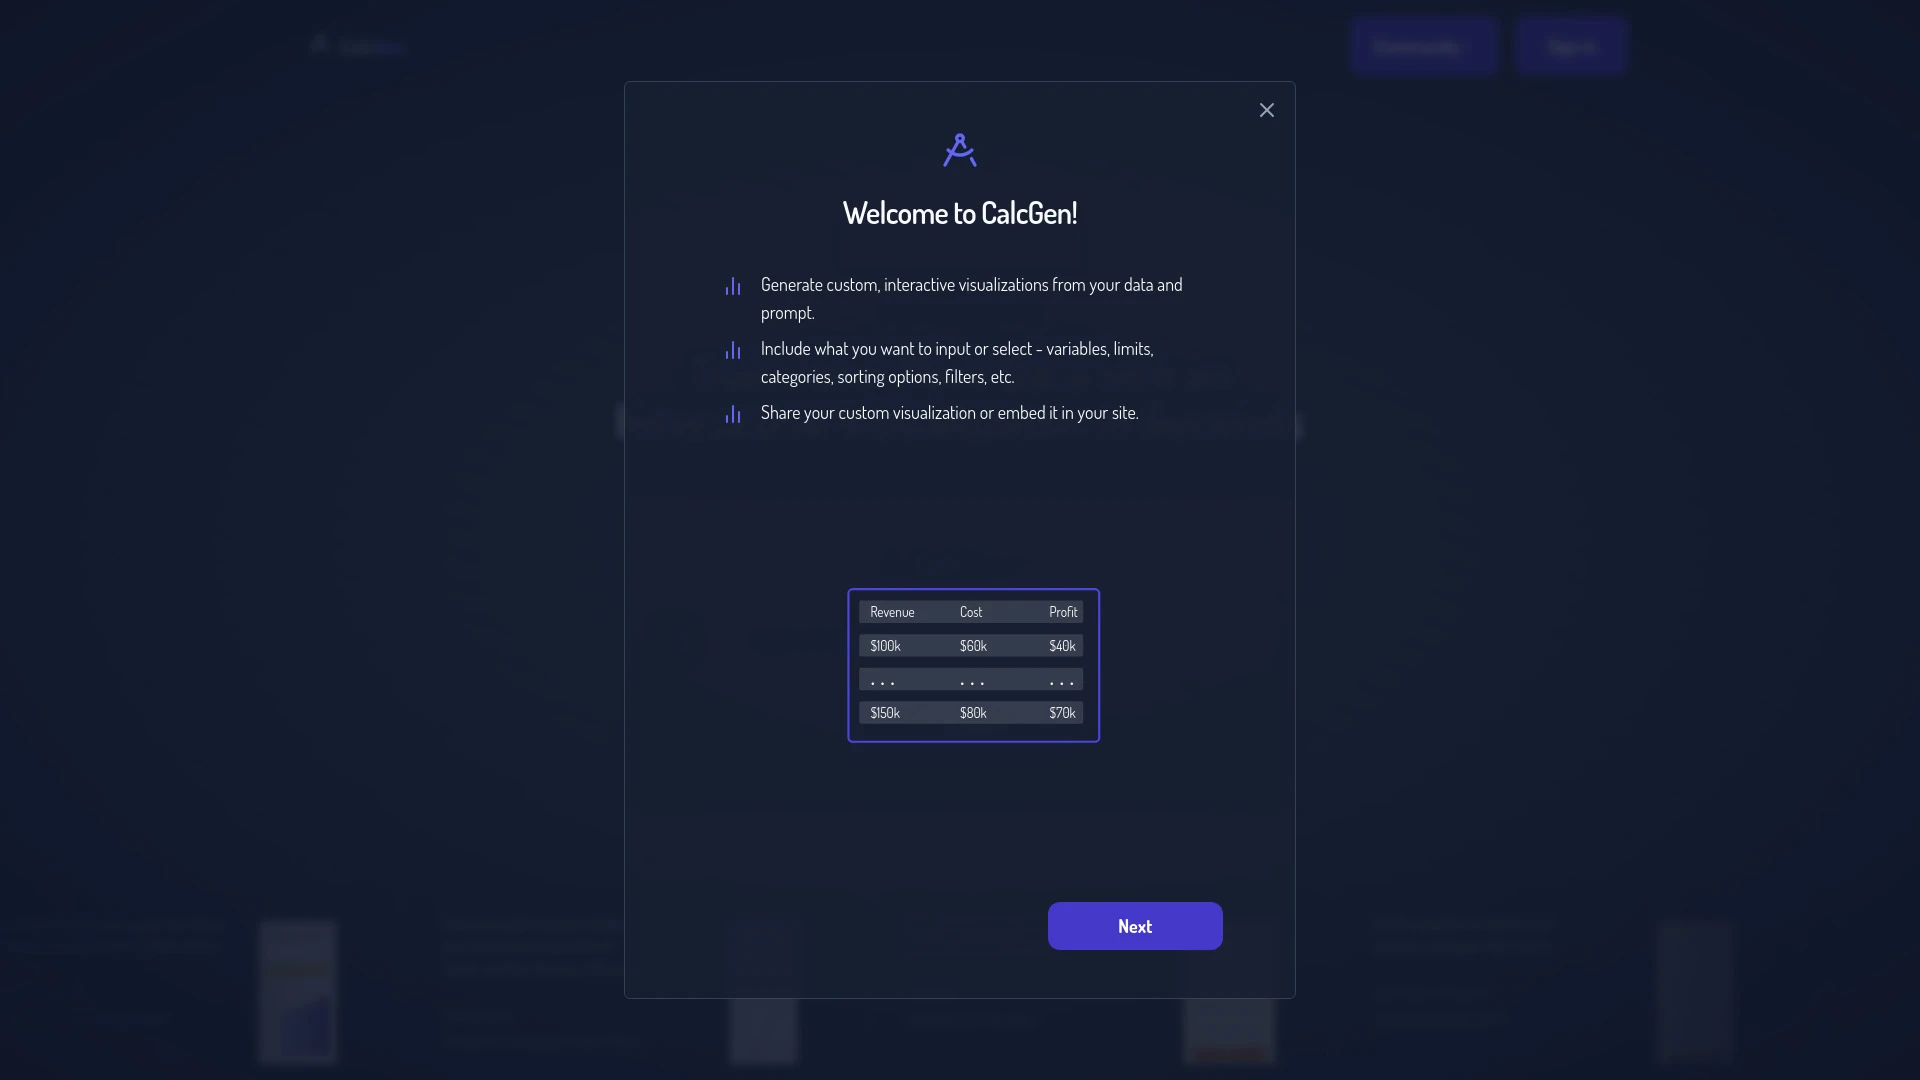
CalcGen AI
CalcGen AI is a user-friendly tool for creating interactive charts, graphs, and calculators powered by AI.
- Interactive charts and graphs
- Customizable calculators
- Data visualization from various inputs
AI Analysis
Why use this AI CalcGen AI for Create Interactive Charts?
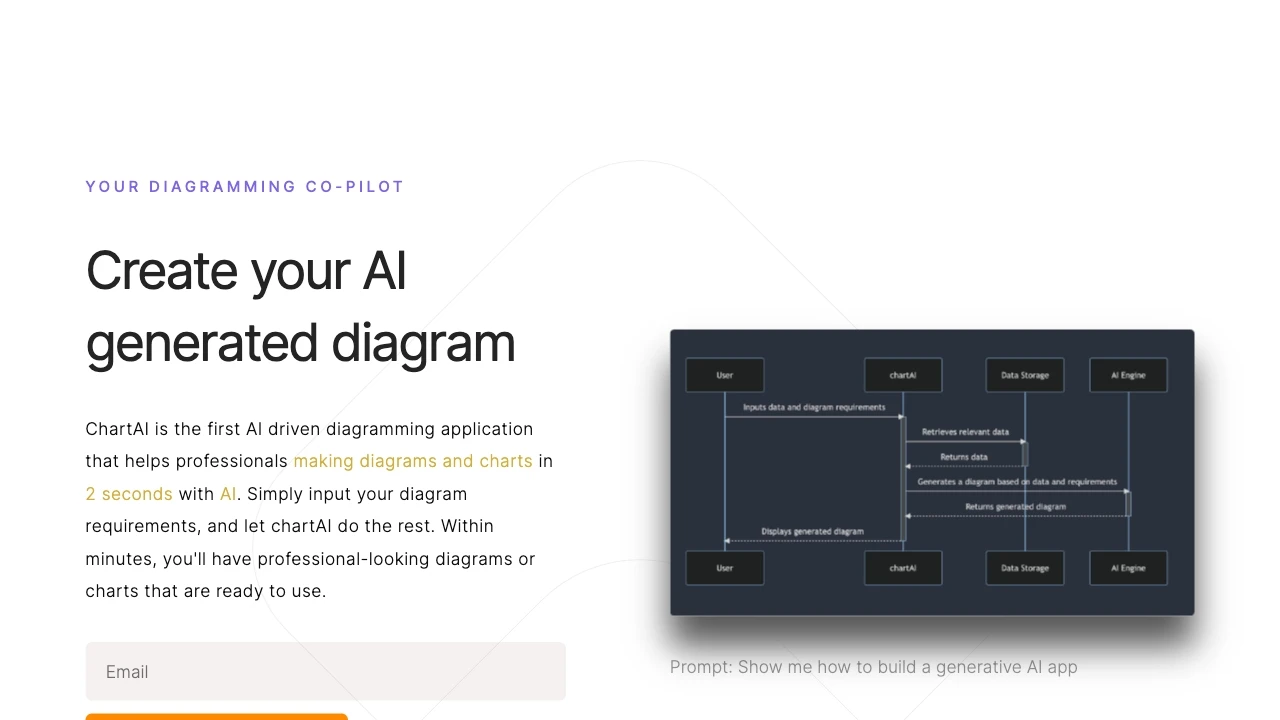
ChartAI
ChartAI utilizes ChatGPT technology for creating and comprehending charts and diagrams effectively.
- Chart and diagram creation
- Data insights and analysis
- Interactive customization
AI Analysis
Why use this AI ChartAI for Create Interactive Charts?
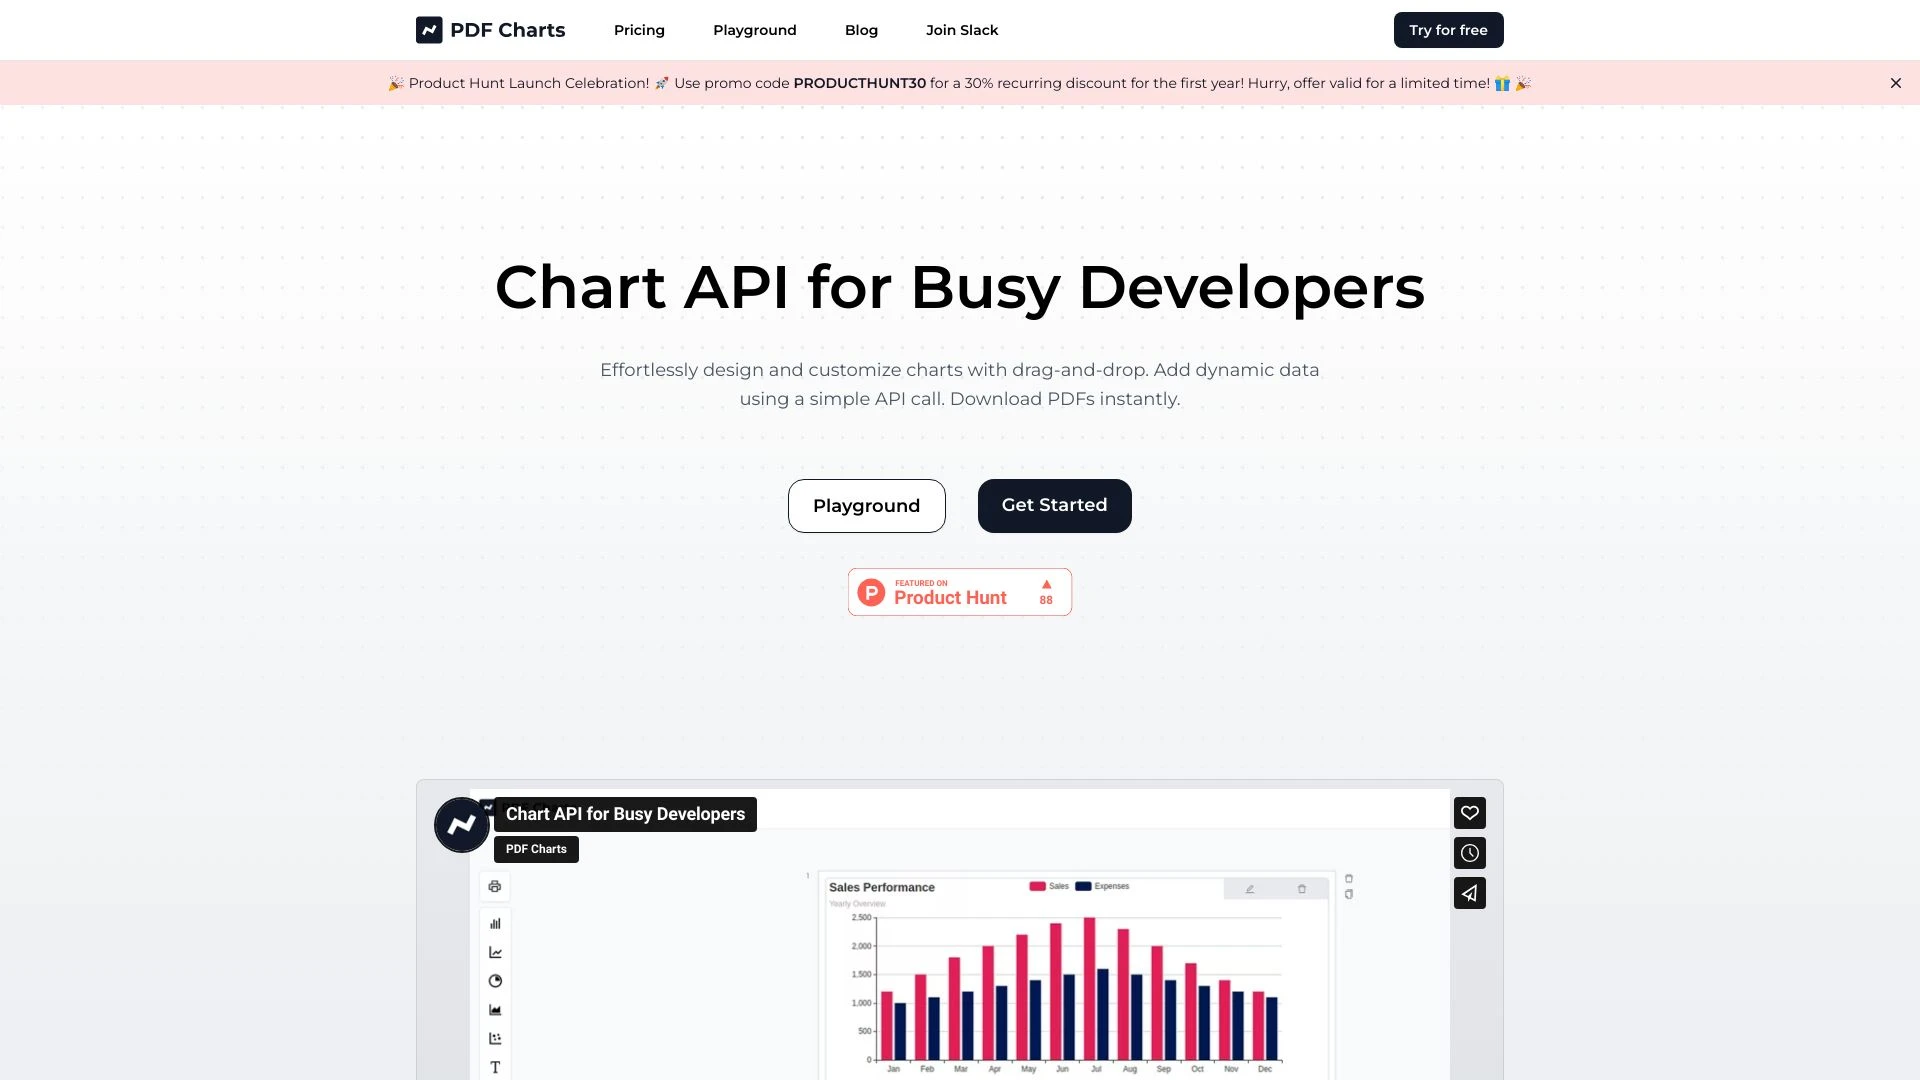
PDF Charts
PDF Charts simplifies chart creation through a user-friendly interface and AI assistance, allowing dynamic PDF chart generation via an API.
- Drag-and-Drop Interface
- Dynamic Chart Generation
- User-Friendly Design
AI Analysis
Why use this AI PDF Charts for Create Interactive Charts?
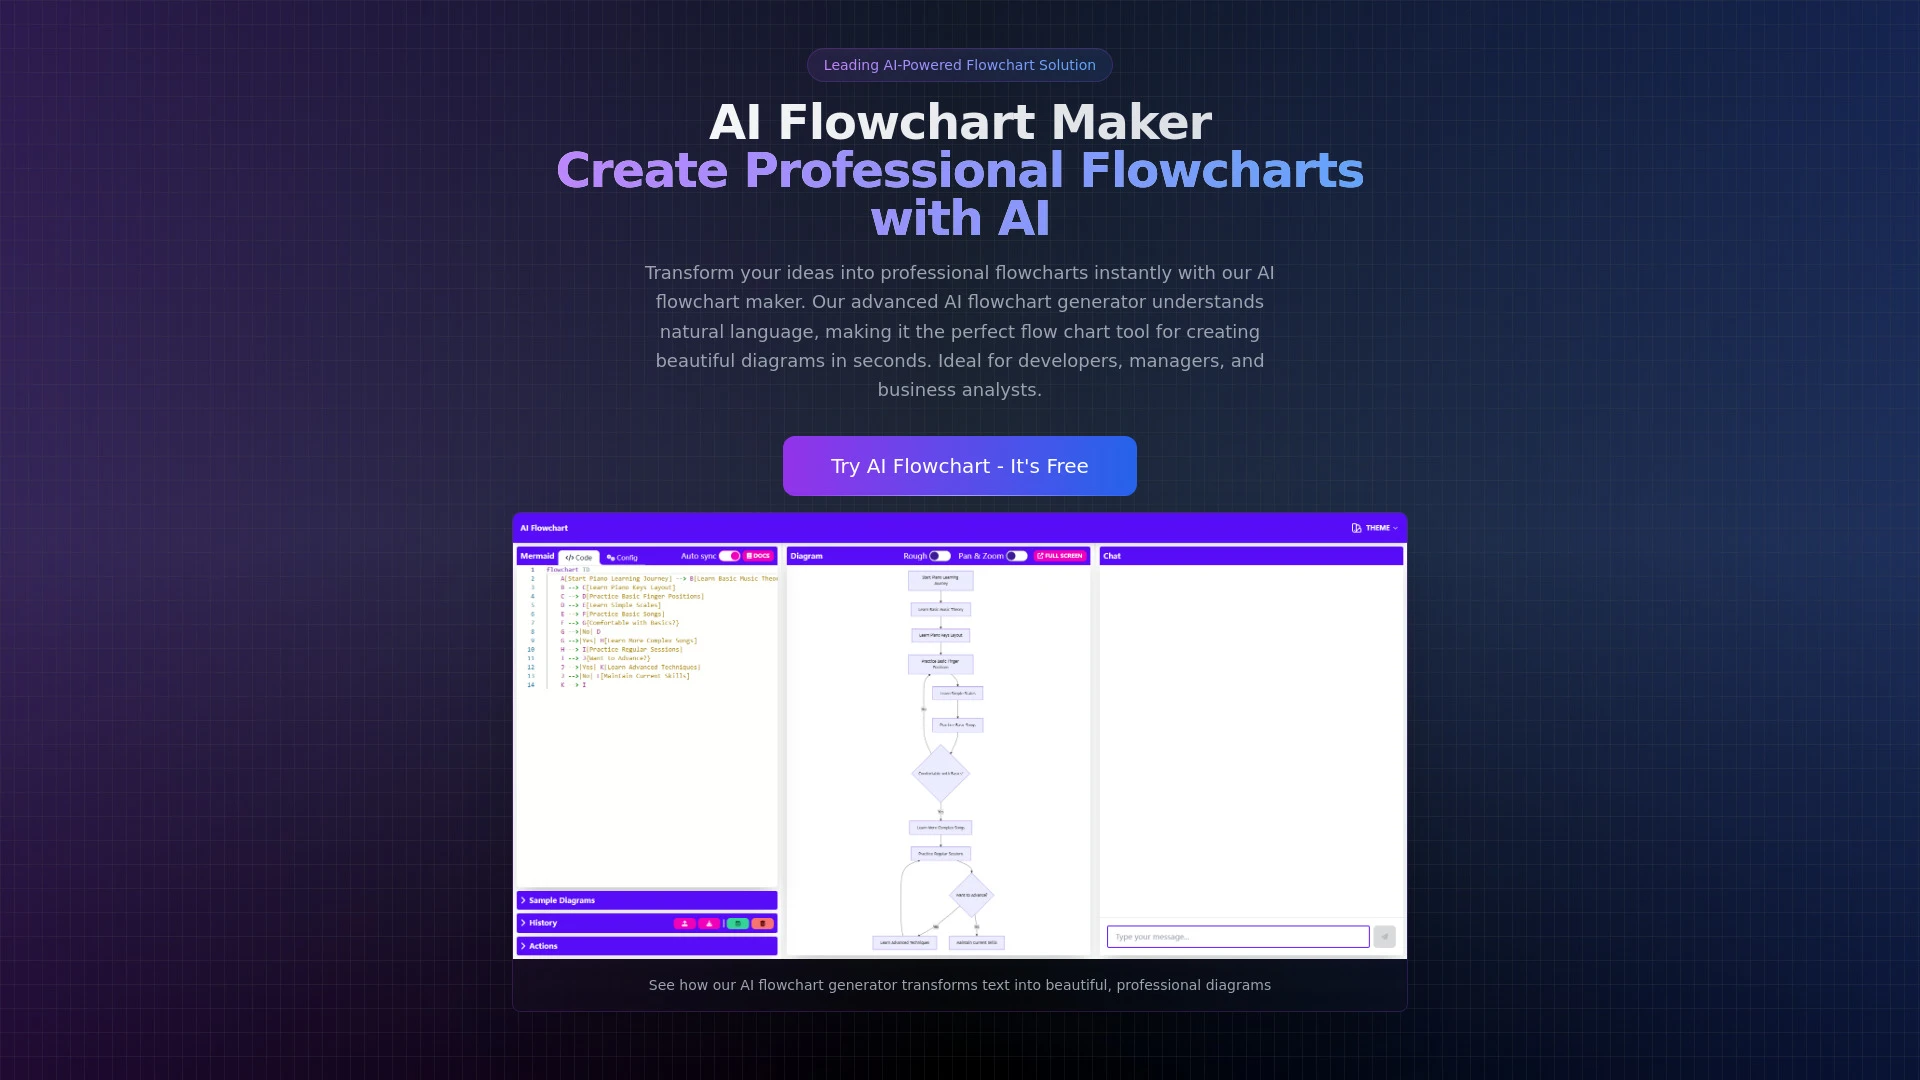
AI Flowchart Maker is an online tool that creates flowcharts from text descriptions using AI technology.
- Natural language processing for generating flowcharts
- Customizable design options
- Real-time collaboration capabilities
AI Analysis
Why use this AI AI Flowchart Maker for Create Interactive Charts?
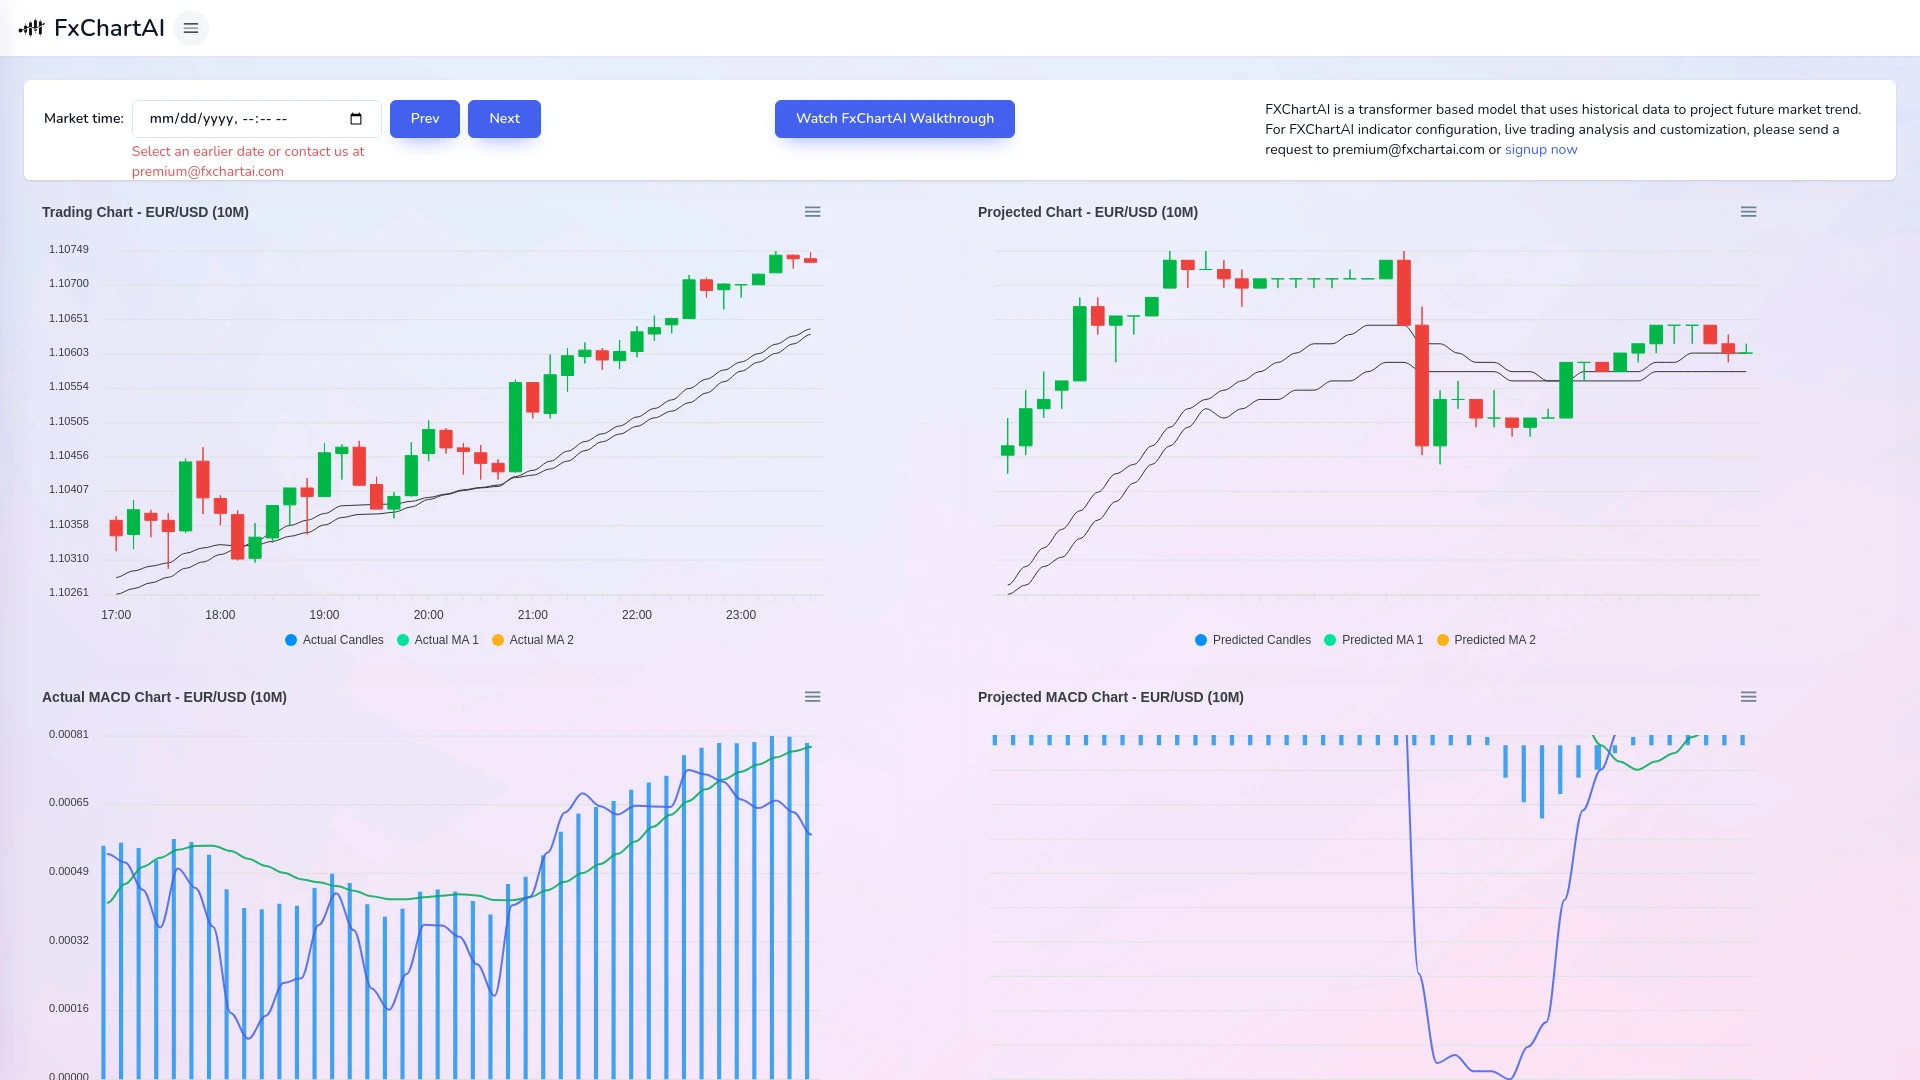
FxChartAI
FxChartAI is an advanced real-time Forex projection tool utilizing cutting-edge models to analyze market trends.
- Real-time market trend projections
- Dual historical and predictive charts
- Advanced multi-indicator trading analysis
AI Analysis
Why use this AI FxChartAI for Create Interactive Charts?
Practical Workflows
Don't just buy tools—build a system. Here are 3 proven ways to integrate AI into your create interactive charts process.
Workflow 1: First interactive chart for complete beginner
- Define the data source and chart type (e.g., bar chart showing quarterly revenue) and connect it to your AI tool.
- Upload or paste a small dataset; select interactive features (tooltips, filters, hover states) and generate a basic interactive chart.
- Validate the chart’s interactivity across devices, adjust colors and labels, export or embed the chart, and noting a simple share-ready version.
Workflow 2: Regular user optimizing daily Create Interactive Charts work
- Create a reusable chart template for recurring dashboards (e.g., monthly sales funnel) with presets for interactions.
- Automate data refresh schedules and generate consistent annotations or narrative insights for each chart.
- Batch publish updates to a BI portal, monitor engagement metrics, and iterate on interactions based on feedback.
Workflow 3: Power user achieving full Create Interactive Charts automation
- Define end-to-end automation: data ingest, chart generation, interactivity setup, and embedding in a live report.
- Leverage AI to suggest optimal visualization types and interactive features based on data patterns.
- Set up governance: versioning, access controls, and automated QA checks before deployment.
Effective Prompts for Create Interactive Charts
Copy and customize these proven prompts to get better results from your AI tools.
Beginner
You are an AI assistant helping a beginner create an interactive chart. Use a simple CSV data sample with columns Date, Sales, and Region. Output a single interactive line chart with hover details and a legend. Provide a ready-to-paste configuration for a popular AI chart tool.Advanced
Role: Data visualization lead. Context: Build a dashboard section for Monthly Revenue by Region with interactive filters. Constraints: must support drill-down from Region to City, responsive layout, export to PNG and embed code. Output: structured JSON with chart settings, data bindings, and interaction rules.Analysis
Review three generated interactive charts for a product funnel. Compare readability, interactivity depth, and data accuracy. Recommend which chart should be used in a quarterly executive report and justify with short rationale.
What is Create Interactive Charts AI?
Create Interactive Charts AI combines data visualization with intelligent automation to produce charts that users can interact with directly. It’s designed for professionals who need fast, accurate, and engaging ways to explore data. Ideal for teams creating dashboards, reports, and stakeholder-ready visuals.
Benefits of Using AI for Create Interactive Charts
- Faster chart generation from complex datasets
- Advanced interactivity like filters, drill-downs, and hover details
- Consistent visuals across dashboards with reusable templates
- Automated data refreshing and annotation for timely insights
- Scalability for teams and enterprise data environments
How to Choose the Right Create Interactive Charts AI Tool
- Data compatibility: supported sources and formats
- Interactivity features: filters, tooltips, drill-downs
- Automation: data refresh, template creation, scheduling
- Collaboration: sharing, embedding, access controls
- Security and governance: permissions, audit trails
Best Practices for Implementing Create Interactive Charts AI
- Define clear objectives for interactivity (what should users explore?)
- Standardize chart templates for consistency
- Test across devices and browsers for reliable interactions
- Document data sources and explainers for stakeholders
- Monitor usage metrics to refine interactivity features
AI for Create Interactive Charts: Key Statistics
Global adoption of Create Interactive Charts AI tools grew 47% year-over-year in 2025, with 62% of organizations reporting faster insight delivery.
68% of teams using AI for interactive charts saw a 25–40% reduction in dashboard development time.
Top use cases include executive dashboards (34%), product analytics (22%), and marketing performance (17%).
Among beginners, 54% started with free Create Interactive Charts AI options before upgrading to paid plans.
Automation-driven templates reduced repetitive chart-building tasks by 38% on average.
Security-conscious organizations achieved compliance through built-in governance and role-based access in AI chart tools.
Frequently Asked Questions
Get answers to the most common questions about using AI tools for create interactive charts .
Create Interactive Charts AI refers to AI-powered tools and features that automatically generate and enhance charts with interactive elements (filters, tooltips, drill-downs) from data, enabling faster insight discovery for teams.
Begin by connecting a data source, selecting a chart type, enabling interactive features, and saving a reusable template. Gradually add data pipelines, annotations, and embed options to share insights across the organization.
Both have strengths: desktop options suit offline work with local data, while cloud-based tools excel at collaboration, real-time data, and scalable automation. Choose based on data security needs, team size, and workflow complexity.
Common issues include unsupported data formats, missing metadata for interactivity, restricted permissions, or a misconfigured chart template. Check data schema, enable interactivity modules, and verify access rights.
Related AI Tool Categories
Explore other AI tool categories similar to Create Interactive Charts that might interest you.
Marketing Plan Generator
The Marketing Plan Generator powered by AI automates and optimizes strategy development, analyzing data to identify targ...
AI PDF
AI PDF refers to the integration of artificial intelligence in working with PDF documents, enhancing processes like text...
AI Photo & Image Generator
AI Photo & Image Generators create visuals from text prompts or existing images using deep learning techniques. They enh...
AI Art Generator
AI Art Generators utilize deep learning algorithms to create visuals based on user input or existing art styles. Tools l...
AI Presentation Generator
The AI Presentation Generator utilizes artificial intelligence to create visually appealing and structured presentations...
AI Trading Bot Assistant
The AI Trading Bot Assistant harnesses artificial intelligence to analyze market data, execute trades, and optimize port...